
Dmytro Spilka
With the amount of information available on the web, it’s incredibly hard to catch people’s attention with another plain text piece of data. People perceive visual data much easier and process the information quicker, especially when it comes to complex data, such as statistics and facts.
Infographic is one of the best ways to present complex information in an easy and visually appealing way. Nevertheless, it can get extremely challenging and time-consuming to design a visual with tools like Photoshop unless you are an experienced designer and know your way around it. Hence, we’ve created this quick overview of the best, in our opinion, tools & resources for creating visuals and infographics.
1. Canva
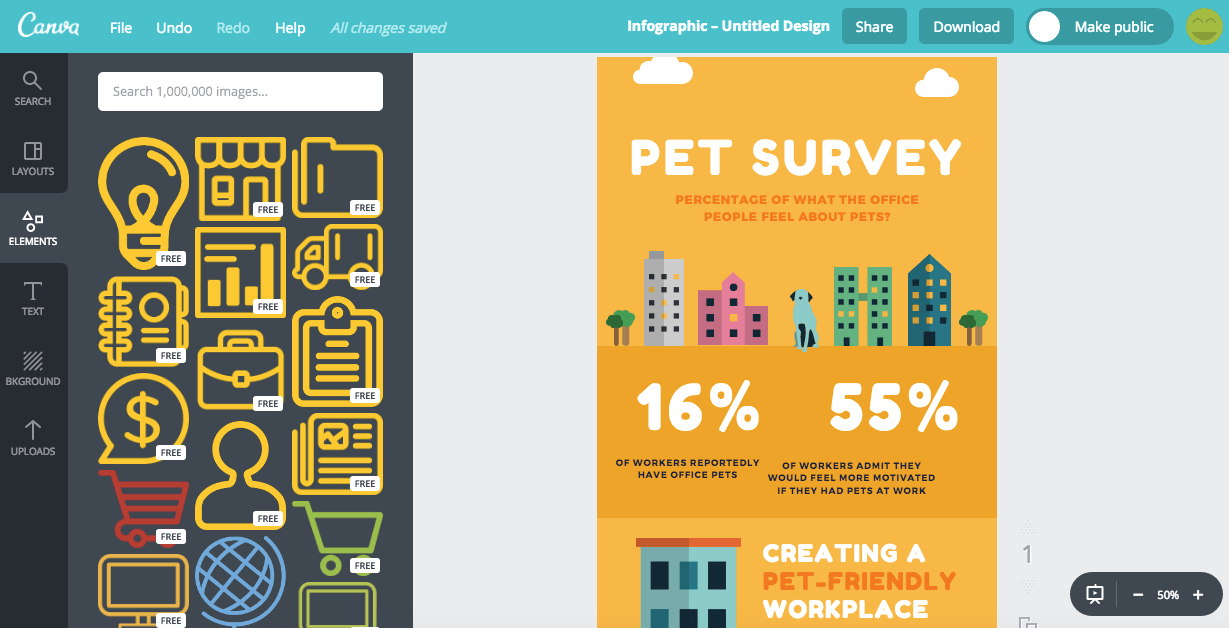
Canva is a simple, free, powerful and easy-to-use visual builder for creating posters, infographics, social media covers, ads, flyers, business cards, menus and more.
With its astonishing visual interface and a handy drag-and-drop builder, it is incredibly easy to get cracking within minutes. Canva offers an amazing collection of elements, images and fonts that you can use for free to design your piece. More premium items available for purchase for only $1.
Unlike many of its rivals, Canva enables to publish and download your visual in both, PDF and Image (PNG & JPG) files.
2. FlatIcon
![]()
Flaticon is just a life saver when it comes to finding the right vector icons for your visual. With its enormous database of over 200,000 icons, you will definitely find the most suitable design for your needs, whether you are working on a web design project, infographic or any other kind of visual illustration. Moreover, all icons are categorised into handy sets, which makes it a lot easier to choose your preferred style and design.
Flaticon enables to download any vector for free in PNG, SVG, EPS or PSD format, as long as you credit the author. Pro version is available for only $9.99/month.
These icons can then be uploaded and used with any design software, such as Illustrator or Affinity Designer.
3. Piktochart
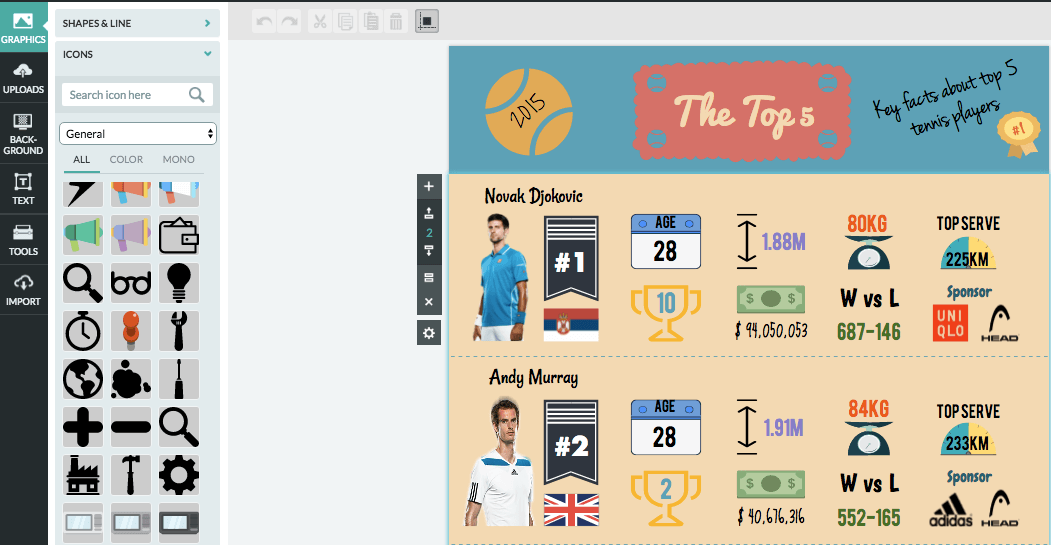
Piktochart is another fantastic platform for creating infographics, posters and presentations. Their user-friendly interface and a simple drag-and-drop visual builder make it so easy to design a visual within a couple of minutes.
Piktochart offers a great collection of free templates, icons, images, shapes and lines. More options available with Pro Packages (starting at $15/month).
4. Infogr.am
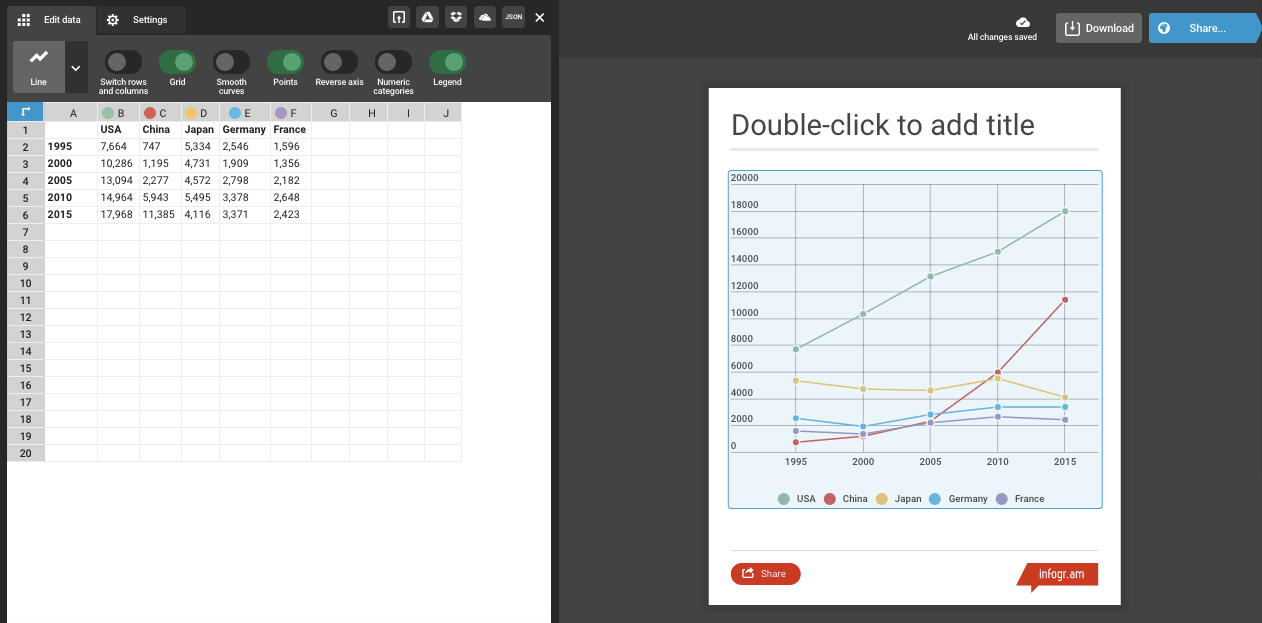
Infogr.am is an amazing data visualisation tool that enables creating interactive charts, graphs and maps to use in your infographic.
Choose from over 35 charts and maps, such as bar, line, pie, area and bubble, which you can easily customise through an Excel style editing tool and display the results in real time. When done, simply embed the visual on your site, download, share on social media or Infogr.am website.
More designs, maps, icons and custom branding available with paid versions (starting at $19/month).
5. Easel.ly
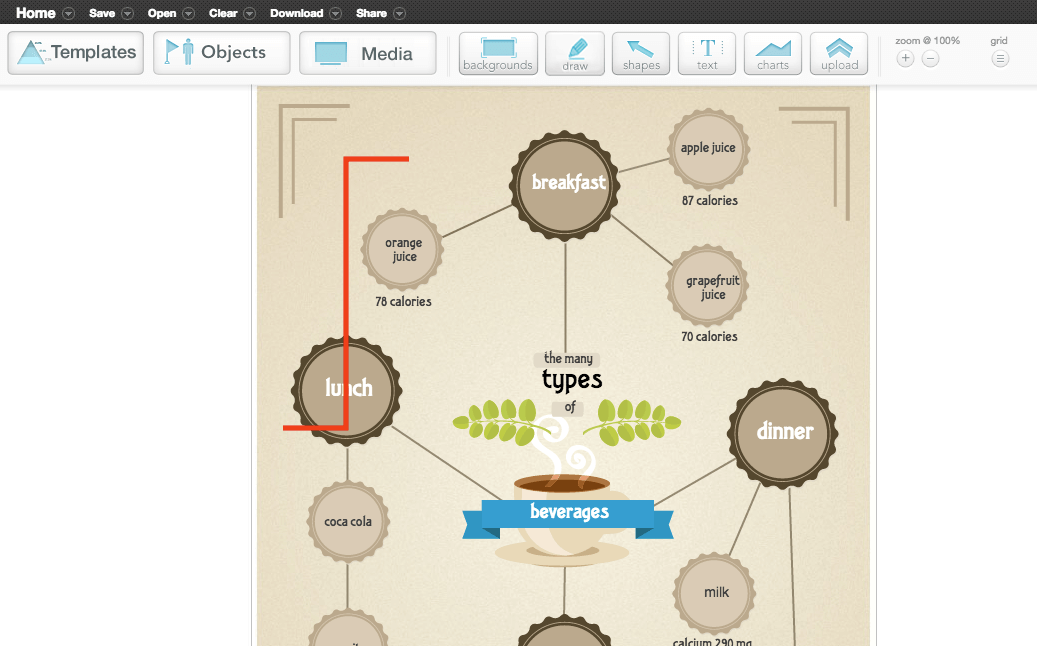
Easel.ly is a web-based infographic creation tool that allows designing, sharing and publishing your work. With tonnes of free templates, objects, shapes and charts it is incredibly easy to get started. You can even upload your own files, such as images and icons.
More features, templates, fonts and pictures available with a Pro Version (only $3/month).

Dmytro Spilka
Head Wizard
