There is much to consider when creating content and it can be mightily tempting to abandon quality for the sake of other content factors. Like copy length, keywords, phrases and clickbaity headlines. When actually, the perfect word count doesn’t exist and keyword-packed content that offers useless or little information is no man’s friend.
Rather, it’s advisable to listen to Google’s suggestions. Since it’s this search engine giant that will play a huge role in determining the success of most content. In doing so, we realise that creating useful, compelling and well-researched content is a far more effective way to influence rankings than false headlines and misleading meta-tags.
This is where content analysis comes in. Its definition is twofold. First, it’s a method of researching existing content that allows us to make valid inferences and find gaps in the information available to us. From here, the content we create becomes useful, original, factually accurate and more likely to be read.
The second application is the study of our own written content. It has become a useful way to measure the quality of our copy and weigh its performance. It contributes to enhanced readability and preserves the longevity of the content.
Hence, for the purpose of improving quality, usability and readability; content analysis is a primary source to achieving content goals. So, how exactly does content analysis work and how is it done?
Content Analysis: Research method
Smart writing needs smart research. Creating content that shows what’s happening isn’t good enough. In a world of infinite information, people are now demanding to know the why’s and how’s. Writers who apply data-driven research to their content will always come out on top and are positioned well against those who don’t.
But the analysis of large quantities of text can be exhausting. Just think of the hundreds of articles that are published and circulate your industry each day. Luckily, basic coding processes in content analysis essentially lets you organise mass amounts of text into fewer content categories.
For example, if a researcher wanted to examine gender representation in the workplace, they could create a list of categories like; levels of seniority, and then count how many occurrences there are for each gender in each category. By dividing content into subcategories; patterns and themes amongst them can be identified. This is critical for good content analysis and gives the writer more information from which they can craft original, interesting and useful content.
In the same vein, content analysis coding effectively allows the researcher to turn qualitative written text into quantitative data; like statistics, graphs and visuals. Categorising texts, attaching numerical values to phenomena and counting specific occurrences of a subject; are all ways of quantifying what would otherwise be written information. From here, such data can be incorporated into graphs and supporting visuals.
This is important if you want your content to make a lasting impression. It’s been found that when people read information, they remember only 10% of it three days later. Whereas, when a relevant image or graph is displayed alongside the text, people are more likely to retain up to 65% of the information three days later (CMI)
On the other hand, it’s equally important to use content analysis to make quantitative data (statistics, figures and graphs) into qualitative content. In most cases, numerical data is only interesting and useful, when put into a wider context. Using statistics, graphs and charts in your content give you the chance to build a case and give context to the data in relation to your subject matter.
Competitive Content Analysis
Part of the reason content is so fundamental to the success of a business is down to its ability to differentiate you from the rest. So, in order to craft original and differentiated content, the first thing to do, analyse the content created in your market.
There’re several tools you can use. One of them is Ahrefs’ Keyword Explorer – a tool designed to provide keyword difficulty and search volume.
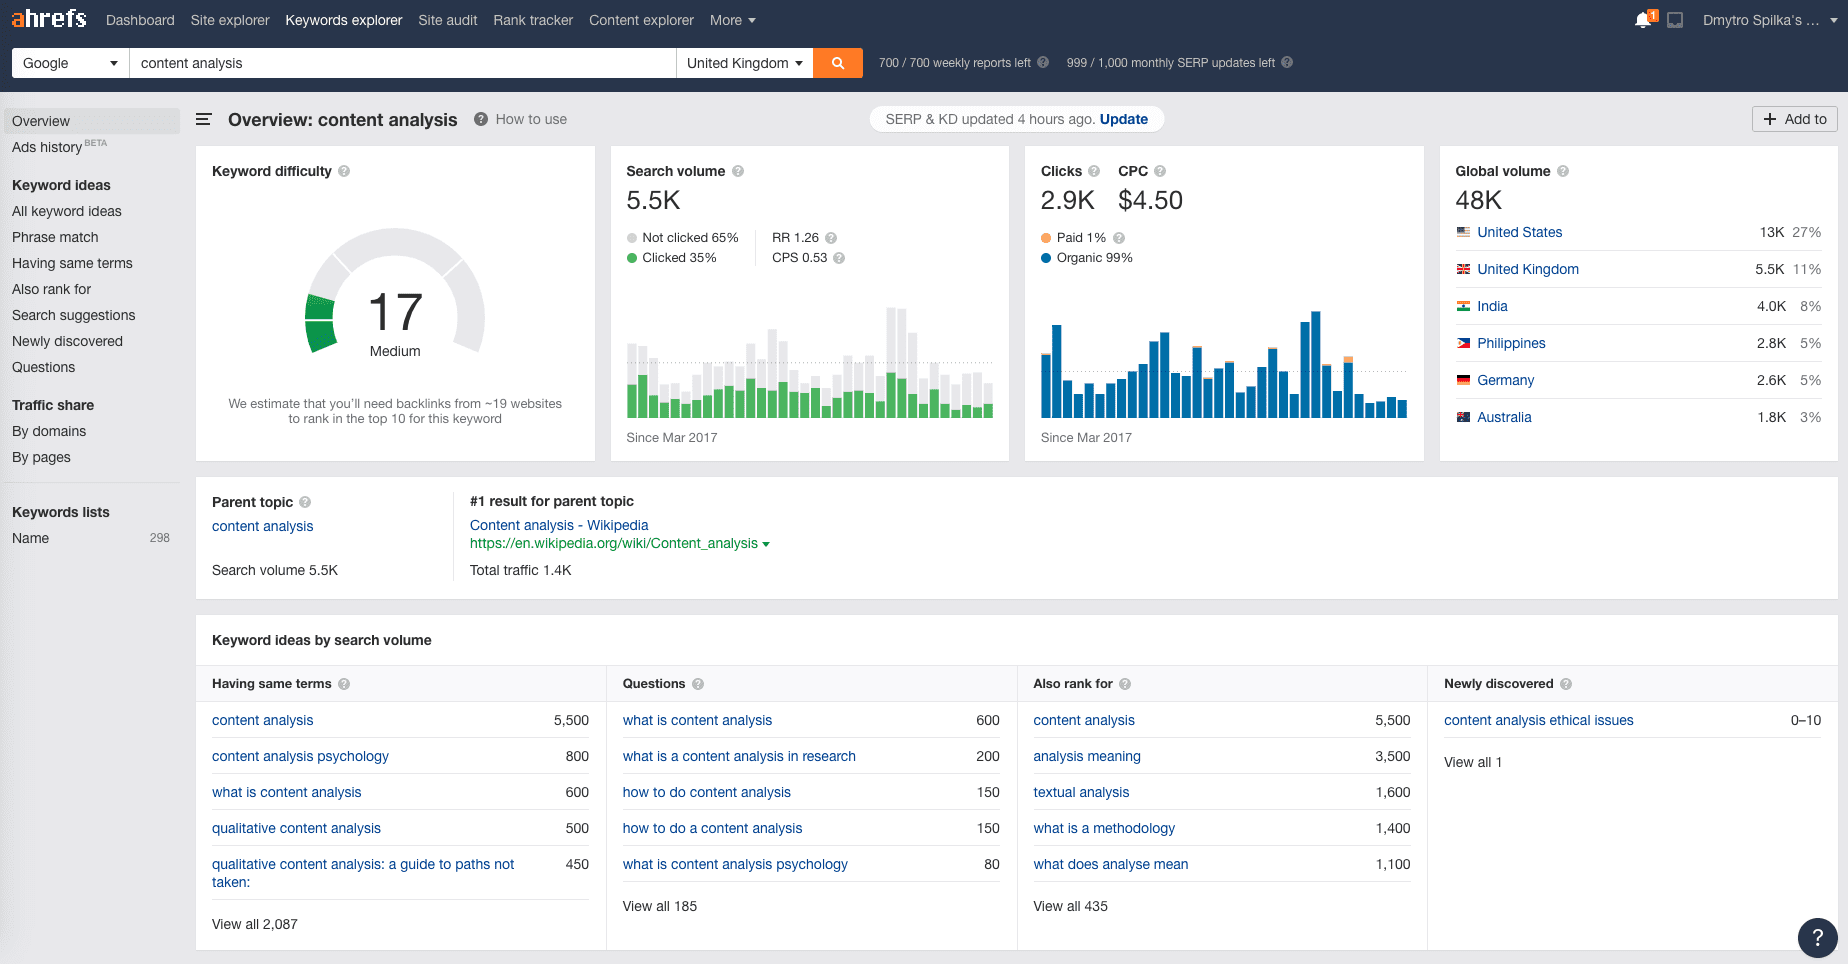
You’ll need a sound awareness of what your competitors are publishing to ensure that you’re creating original, interesting and valuable content for your target audience. Comprehensive competitive content analysis can help you stay one step ahead of your competition and position yourself as a market leader in your industry.
The process is simple, cost-effective and timely.
1. Make a list of your competitor’s who are creating content. Capture all mediums from blog posts to videos and infographics. You should be able to determine the approximate level of investment for each – which may well help you decide what’s best for your content investment.
Take advantage of your competitor’s work. Presumably, they’ve carried out some market research of their own. Use your better judgment to make inferences on the market, using competitors content. For example:
- Blog articles – can give insight into the relative importance of topics and keywords. Short-form, frequently published topics suggest popular and highly demanded content.
- Webinars – a great source of explanatory information for both customers and industry professionals. They delve into detail on topics that are of particular interest to your target audience.
- Audio content – gives evidence of precisely what your competition thinks about certain topics and where they assert their emphasis.
- Email newsletters – the content sent directly to prospects and customers reveal what companies believe to be most valuable. Often information on up and coming content in the future will be released.
2. Analyse the competition’s content quality and quantity. For the analysis to contribute to the success of your own content, you’ll have to understand how well their content is performing. Key metrics, like engagement level; including, comments, shares, likes and reactions; are easily accessible and represent the contents true value according to the those who consume it.
At the end of this stage of your competitor analysis, you should be able to compare several companies content, in terms of their channel, quantity, frequency, and quality. You may want to consider taking a page from those who come out with good performance indicators.
For example, Company A published 200 posts of medium quality 3 times a week on its blog. At 500 words per post, each received a minimum of 5 comments and 20 shares.
Clearly, this analysis means very little before it’s compared with that of another company.
Company B published 120 posts of high quality once a week on its blog. At 700 words per post, each received at least 3 comments and no shares.
From this analysis, we observe that the company that publishes shorter blogs more frequently had significantly higher standards in terms of performance. From here, it becomes advisable to take a leaf out of company A’s book when strategising your content.
3. Focus your attention to the content topics. Original and unique content can only be achieved provided the topic has not already been hammered in by others in the industry. Pinpoint content gaps by tagging and analysing the topics of each piece. Take advantage of this opportunity by crafting the perfect piece that will provide missing answers.
Obviously, you couldn’t be expected to keep tabs on every single piece of content’s headline and description that circulates your industry. There’s simply too much content for this to be viable. Instead, begin with the most recent posts or the most popular pieces and channels and categorise them into broader topics.
This way, you will be able to recognise and analyse trends. By looking at the combination of quality and quantity according to the topic, you will know exactly which topics to steer clear from. In other words, you will have created a clear cut map that shows exactly where your content should slot in.
Social Media Content Analysis
Of all the content-packed places, social media platforms offer a powerful source of unconfined consumer thoughts and opinions. As of 2019, there are 3.2 billion social media users worldwide and this number is only growing (SmartInsights) With so many users, comes a lot of data.
On the one hand, social media analysis is pretty clear-cut and many indicators are readily quantifiable. For example, 20 ‘likes’ on Facebook, translates into 20 people saw a post and engaged with it positively. 20 people are better than 10 people but not as good as 50. But that’s not the end of the analysis. The deeper meaning behind the action of those 20 people has boundless variables and situation-based considerations to be accounted for.
How then, can businesses effectively draw on this source of data to find deep and actionable insights? The analysis of social media data – as a subsection of the wider content analysis, allows for examining and putting to use the qualitative data produced by consumers.
There are two ways to find, analyse and use the content that exists on social media.
The first is to generate metrics that accurately reflect the data. There are a number of tools and services that produce instant summary statistics of the data. For example, web-analytics can help to put an exact figure on word count, audience reach, engagement and sentiment analysis. These provide valuable real-time and comparative metrics of the website.
Yet, no algorithm can be a match for the in-depth analysis of consumer-generated feedback. Especially when it’s conducted by a skilled analyst with a deep understanding of the brand, its challenges and opportunities. This second social media analysis strategy draws from the best practices of traditional content analysis and is applied with modifications to social media data.
Analysing social media content can be broken down into the following 5 steps:
1. Develop your research objectives as you would before conducting an analysis of any other data. Keep in mind why you are conducting this research and what decisions will be made with this information? Whether it’s research in preparation for the launch of a new product, or simply sentiment analysis that will complement your next piece of content; establish and keep your research objectives in mind.
2. Identify your keywords. This follows the discovery of your research objective. Consider which terms and synonyms might be used and in which combination, by your target audience. An obvious place to start would be brand names and product descriptions. For a deeper analysis, investigate what activities, events and emotions are related to your objective by exploring the market itself.
3. Decide where you will be looking for your data. In other words, what are your social media data sources? Turn to online tools like Scout Labs and TweetDeck to point you in the right direction. But remember, that these tools don’t account for everything and can miss some important social media platforms.
Refer back to your research objectives to identify the most promising social media sites that will provide the most consumer-generated data. Options are copious and range from social networking sites like Instagram and Facebook, video content like YouTube, product and customer service review sites like Yelp, blogs and microblogs like Twitter. With so many sources generating useful data, there is always exciting and relevant consumer-generated feedback emerging.
4. Organisation of your data is critical to your analysis. Not all the data you gather will be clearly formatted in text or measurable statistics. In fact, much of it will need your interpretation and organisation. Images, infographics, videos and consumer engagement all give useful insights into consumer-opinions.
You can find help achieving this from online tools and software such as HootSuite, Radian6 and NVivo. These are useful but don’t negate the power of human interpretation and analysis. Remember, you have to fully comprehend the data to put it to good use.
You’ll know when to stop looking for new data sources when the amount of useful information you find is relatively less than the effort you put in. At this point, end the searches and move onto the analysis.
5. Analysing your social media data is a similar process to that of traditional content. Begin with reviewing and familiarizing yourself with the data. As you’d have already organised it, identifying trends and key themes should be easier. Look out for trends in behaviour, beliefs and sentiment. Code them accordingly, using traditional software like NVivo. Integrate and compare your findings and log all results.
Following the analysis of your data, you should be in a good position to better account for those ‘20 Facebook likes’ and attach a deeper, more meaningful analysis to them.
Personal Content Analysis
The application of content analysis extends from that of existing copy to your very own. There are ample reasons to do content analysis on your written copy, from maintenance to measuring its performance and editing.
Motivations behind crafting content, to begin with, might include, to provide more accurate information to prospects and customers, building trusty relationships and establishing oneself as the market leader.
Problematic content doesn’t contribute to any of the above and constitutes outdated, unpopular and irrelevant information. But how can we identify such traits in order to correct them and get content marketing strategies back on track?
The first step towards detecting and diagnosing problematic content comes with periodic content analysis. At least every six months, your content should be measured against specific content qualities such as relevance, clarity, completeness of thought and logic, influence and engagement, findability and branding.
Measuring content performance
Your key metrics are only as useful as you make them. One’s ability to identify, measure and analyse them should be high up in your priorities. It’s not surprising that 89% of marketers ranked this as a top priority in a 2017 Demand Gen report (ClickZ).
Key metrics that ultimately influence content qualities as listed above include site traffic, on-site-time, on-page and off-page SEO, returning visitors, social engagement metrics like shares and comments, and conversion rates. And it’s these figures and trends that must remain under a watchful eye to promote the best performing content.
Arguably the most primary of indicators is the traffic to your website. It offers a good indication of the number of visitors you receive. Respectfully, large waves of consistent traffic to your site initially reflect good content that people are interested in.
But measuring traffic alone isn’t enough and can be incredibly misleading. Following further inspection of your traffic, it’s important to note where it comes from and where it goes. If further analysis reveals s dramatic bounce rates, one might logically conclude that the actual content is insufficient, uninformative, dated or simply not reflective of the headline.
The importance of knowing precisely where your traffic comes from is incremental to the long term performance of your existing and future content. High organic traffic with a bounce rate that doesn’t compliment your content strategy should suggest content edits are required to accurately reflect headlines and meta tags.
If large volumes of traffic are found to be derived from external links as a result of guest posting efforts, this data should be incorporated into future content marketing strategies. This is because the data reveals that people have been inclined to click a link that redirects them to your site. Provided your content is useful and engaging, there are few reasons for them to abandon your page.
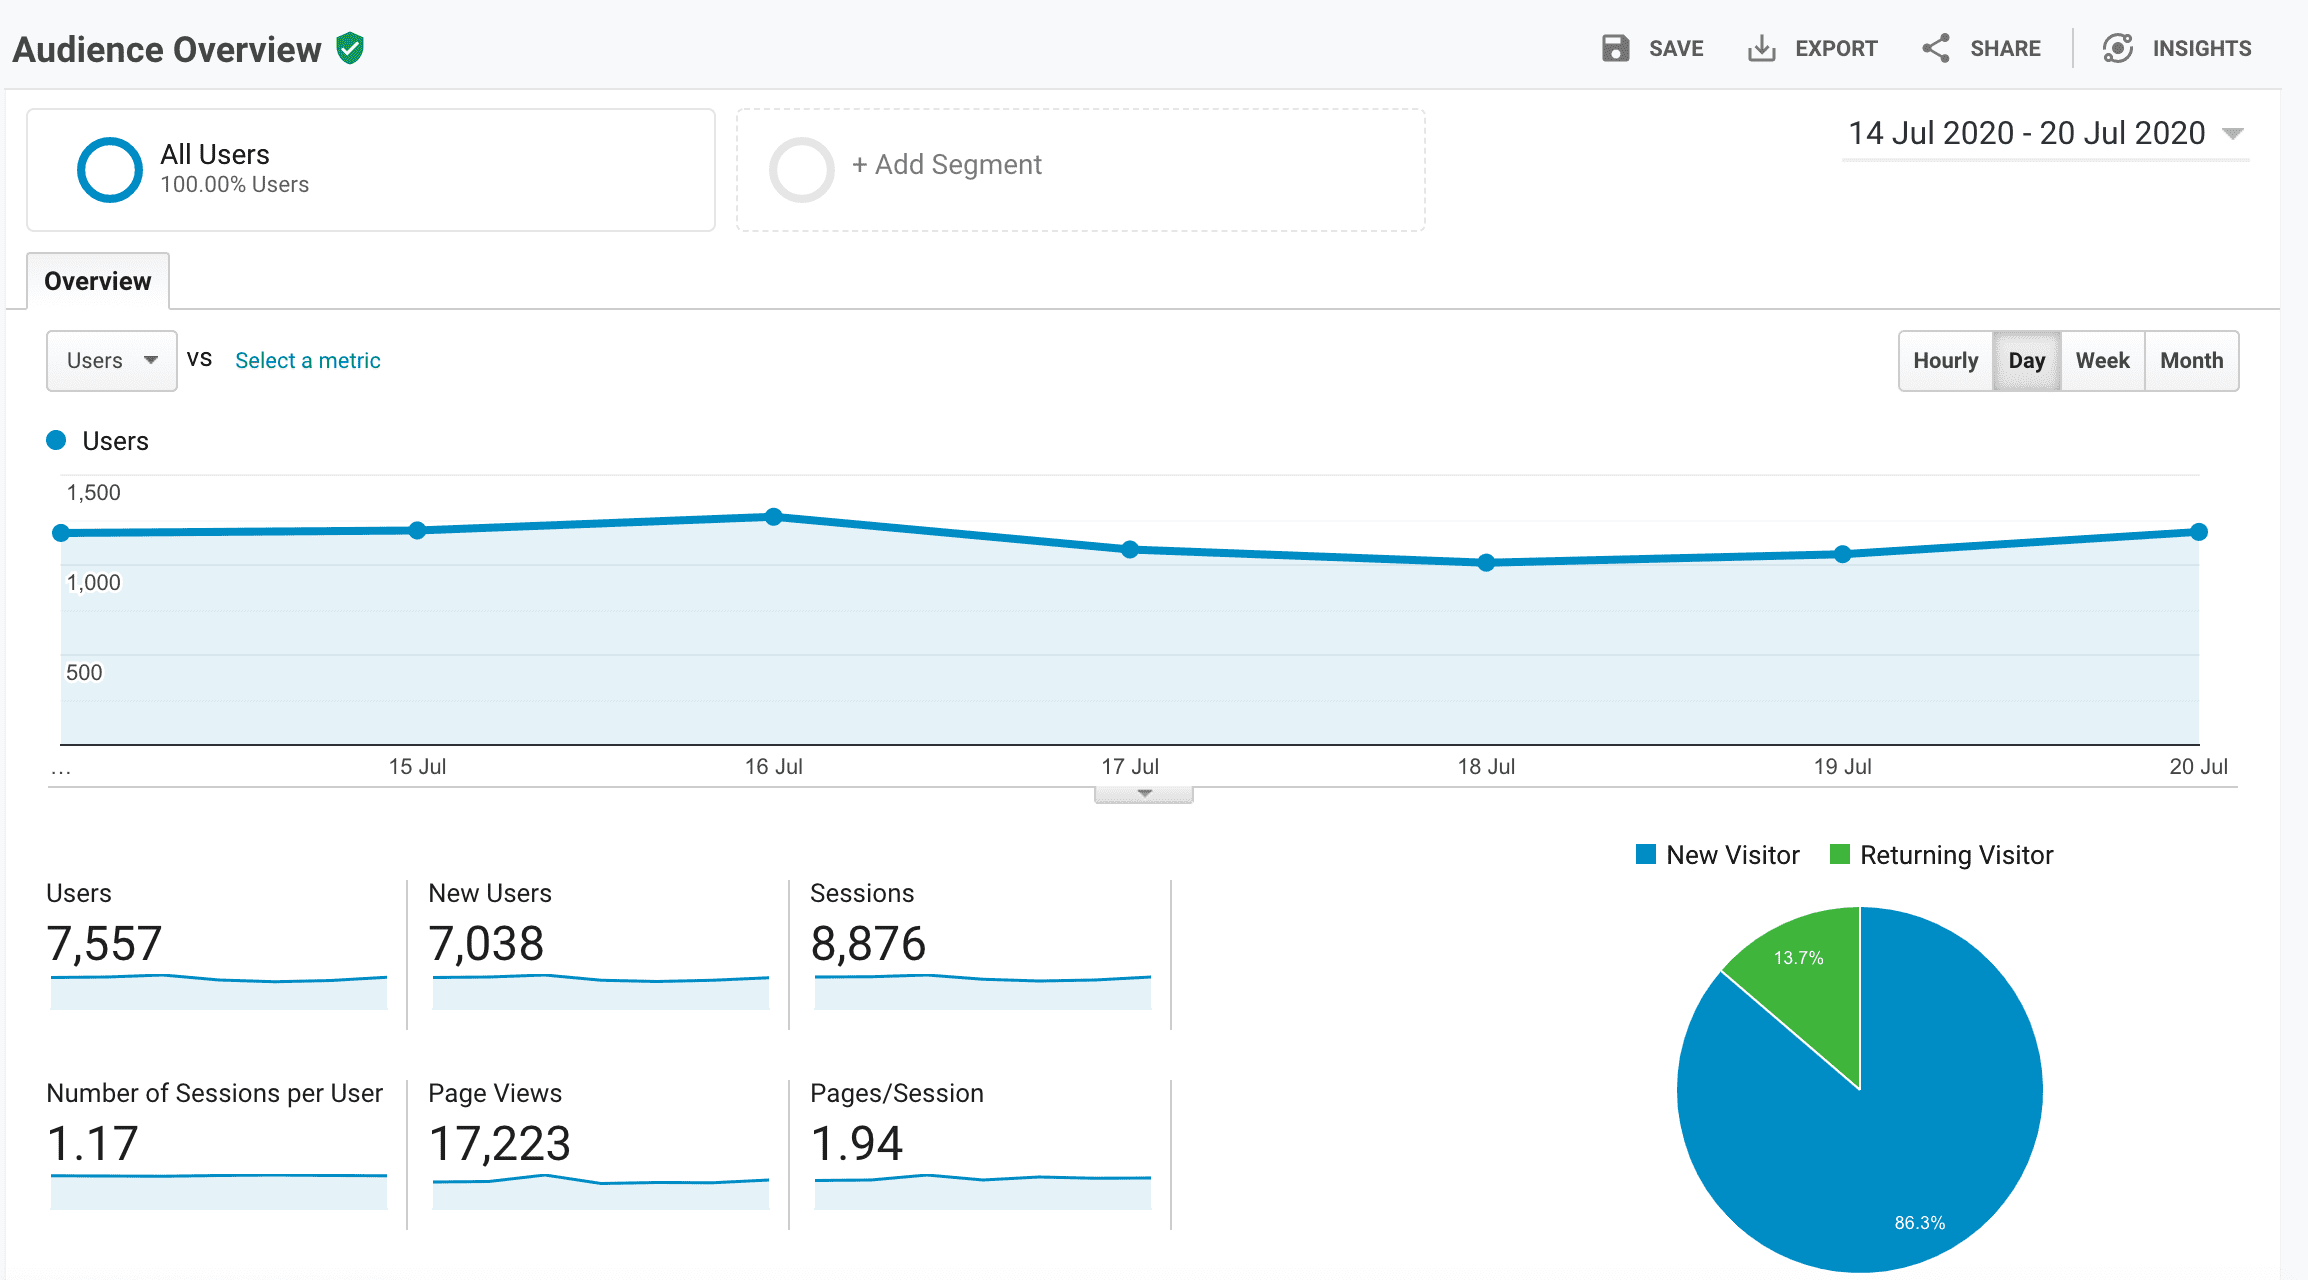
Analysing traffic manually is near impossible but there are some useful tools for the in-depth analysis of traffic, including Google Analytics, Open Web Analytics, Matomo and Clicky.
No content analysis is complete without measuring the on-site time. Similarly to bounce rates, this measurement should give a good representation of how your visitors perceive your content. By considering the amount of time a user stays on your site, you can begin to get an appreciation for your contents ability to retain readers. If website visitors are just dropping by to abandon it, action should be taken.
A short on-site time average can be attributed to a number of factors. A more typical factor includes long loading times. If this is found to be the case, reassess your website hosting options.
You’ll want to be acutely aware of the return on your SEO efforts. The findability of your content depends fundamentally on your SEO. High rankings will boost your content to the early pages of search engine results and resultantly increase its chances of being clicked on.
Investing in Search Engine Optimisation is all well and good, provided you pay close attention to its return. Improvements in the ranking and authority of your website the ultimate aim. In the absence of these improvements, more investment is needed and should be strategized following the complete analysis of your content.
Does your content analysis unveil a host of returning visitors? Excellent. This group make up the backbone of your entire website. The higher the rate of returning visitors (RRV), the surer you can be that your content is performing well and is providing value to your visitors.
Not only is it a reassuring metric, but it has also been found that content marketers who focus on the retention of customers saw an ROI growth of more than 15 times. Those that solely focus their content efforts on attaining new customers remain witnessing ROI growths of just 4 to 6 times.
Little else enhances reputation, drives traffic and brings in leads quite like the shares of your content on social media. Don’t forego the importance of measuring the presence of your content on social media, as its an accessible place to attain actionable data.
Facebook, Twitter, and Instagram have opened the door to deep analysis of public engagement with your content. Often such engagement is materialised through some sort of action. Naturally, feelings of positive or negative sentiment are attached to that action. In 2016, Facebook introduced the option for users to ‘react’ to posts as an extension of the Like button. Whilst these reactions remain limited in terms of expressions, it nonetheless allows Facebook users to choose from six different emotive reactions: Like, Love, Haha, Wow, Sad and Angry.
Engagement goes a step further when content is shared. This suggests that a user found your content to be useful, interesting and engaging., So much so, that they decided to share it with their followers. If this is a metric to be taken into serious consideration, then the more your content is spread across the internet with little input from yourself, the higher your ROI, the better your brand awareness and the stronger reputation you’ll receive.
Online tools and software take care of the mathematics and science behind your content. All there’s left to do is analyse the findings and make changes.
No changes required? Great! Don’t change a thing if your content is performing at 100% capacity. However, the process of ‘not changing anything’ requires maintenance, which often demands a few tweaks and well, changes.
Content Maintenance
The maintenance step in the process of content analysis has somehow come to lack the urgency that content creation and delivery both widely possess. After a long process of research, and once the adrenaline of creating new content fades, marketers generally have just about enough enthusiasm to monitor how the content is first received. Little attention is paid to the continued lifecycle of said content.
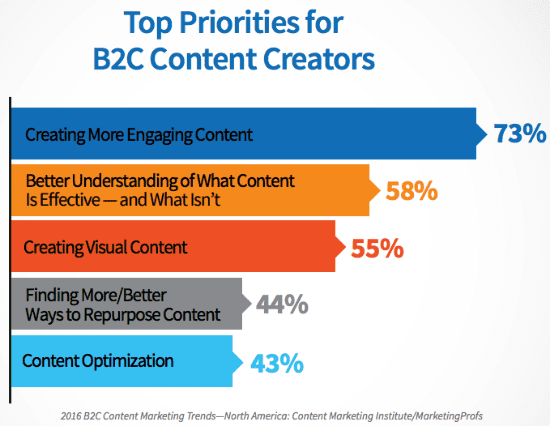
Image Source: KoMarketing
In essence, content maintenance serves two main functions and allows for the birth of a plethora of extensive content benefits:
- Countering entropy, where content inevitably begins to decay as a result of various factors
- To improve the relevance of content through optimisation
A content maintenance plan should reflect all content objectives. As such, it should assure consistency, aim to reorder and reuse old content, check and confirm the working order of links and metadata and completely remove redundant content.
Rules governing content should be set in place to keep content up to date. To do so effectively, a good understanding of why content goes out-of-date is essential. Well, like all good things in life, content has a use-by date. Deteriorating factors include time itself, a change in public opinion or brand image, and the continued proliferation of competitive content making its way into the arena on a daily basis.
Once that date comes round, it’s time to inject it with more life, functionalist and validity. Updating content presumes the role of content accuracy updating and technical updating. What has changed factually since the content was published? The natural tendency of facts to go out of date makes them subject to revision. A change in brand image, product names, leadership, or role within the wider market, may impact many features in content that make reference to these now-changed facts.
Optimising content to make it more relevant for both old and new audiences involves the consideration of several factors. First, what content and how much of it is to be optimised as part of the ongoing maintenance plan? Second, choices regarding evaluation methods and updating strategies are to be made.
There is a range of approaches available to approach optimising content for today:
- Through content analysis – think about usage, engagement and performance.
- Survey attitudes, sentiments and preferences relating to your content.
- Test your content frequently for comprehension and receptivity.
Technical updating can curb technical decay. You can create the most compelling and insightful content imaginable, but without the appropriate technical support, your content will go nowhere. The clearest example in this care is broken links. A perpetual maintenance plan should be set in place and adhered to for the regular checking of all links. Especially the links that redirect visitors to a page that you have no control over.
So, not only should content be kept up to date with the world around us, but should be actively managed to perform at its optimal capability.
Content Analysis Tools
Mentioned above are a few specific tools to aid your content analysis endeavours. But find here, a list of all the help you’ll need to make the most out of your content analysis. Developed specifically to help you understand the performance of your site to determine the level of content efficiency.
Most of these tools analyse the data they collect and create understandable visuals of your website from different angles. Use the information to adjust your content strategy and ensure you generate the most organic traffic that funnels through your site accordingly.
1. Google Analytics and Databox
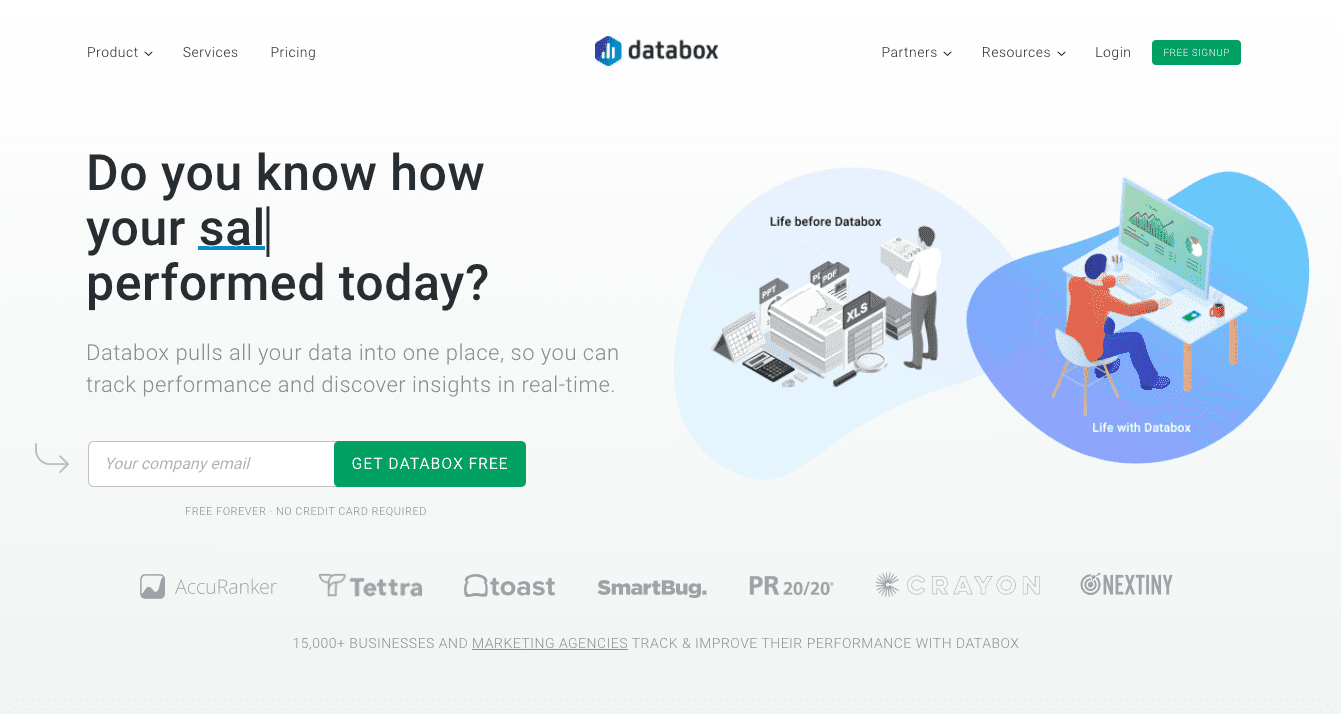
Those with an inkling about website performance indicators will have heard of Google Analytics. It’s a free, comprehensive platform that gathers and displays information on everything from site traffic to browser distribution.
Google Analytics with its broad range of functionalities, can make content analysis slightly overwhelming when it comes to finding the metrics that matter to you. However, when integrated with Databox. you can pull specific information into a dashboard for instant access to the data you care about.
Databox’s pre-built template immediately lets you check your pageviews by page, new sessions by landing pages, pageviews by country/city, and bounce rate by page.
2. Check My Links

This behind the scenes link checker crawls your site pages and detects broken links. This extension is especially useful for content maintenance. Not only does it look for broken links in your existing content but acts as a live tool when creating new content. It enables you to make sure you’re publishing fresh articles with no errors you’d have to correct later on.
3. ClickFlow
Content analysis is all about researching, writing and maintaining for the best content possible. ClickFlow analyses all the content on your site and offers suggestions based on articles with high impression rates (your content on SERPs) but low clicks in the result. With this information, you can make amendments to the article’s headline and meta description and then test its performance against that of the old version.

Better yet, ClickFlow will notify you 15 days later to show you how your changes impacted the performance of your content.
4. BuzzSumo
Widely recognised for its slew of content analysis tools that provide great insight into the performance of your own site as well as that of the most popular content online. BuzzSumo helps you to discover what type of content performs best by domain, monitor brand mentions and backlinks, discovers influencers by keyword and contributes o competitor analysis.
 194 customers signed up in the last 30 days